30 Apr 2008

Our Urbanism Maps - beta v.1


Vakhtang and Sahand... I didn't copy your maps off your drive... so please post them.

societal influence

- based on their foundational usefulness and societal influence.

  • World Wide Web: besides making the Internet easier to use, it was also free whereas Gopher would no longer be free to use.
  • Java: a programming language that is both open source and non-platform specific.
  • Linux: Forced Microsoft, a monopoly, to compete with a free and ever-improving operation system. Also brought awareness to the concept of open source.
  • PageRank: an improved search engine algorithm based on the assumption that better quality webpages are linked to more often.
Wikis: web pages that can utilize collective intelligence by being editable from more than one terminal

check out visual thinking maps

follow link here

http://www.visualcomplexity.com

whole internet on this page


a map of the entire Internet, displaying the owner of each of the 4,294,967,29 available IP addresses (i.e. grey boxes) & the exact IP addresses that are listed on the Spamhaus XBL blacklist (i.e. red dots).

see link here

New Inventions in Construction Material

- Bio steel
-
High Performance Concrete
(6x 10 sheet just 1 inch thick that bends as it continues to support a 2,000 lb car.)
-
Light transmitting Concrete
-
Translucent Concrete
-
Pervious Concrete
(The pavement that drinks water)
-
Foamed Aluminum
-
Natural Polymers
-
Expandable Cement Mixture
-
Rubber Sidewalks
-
Plasphalt
-
Light Emitting Laminated Glass
-
Translucent Fabric
-
Polution Reducing Cement
-
Texlon Roof System (Inteligent and dynamic cladding system)
-
Transparent Solar Cells / Spherical Solar Cell
-
Biodegradable Plastic

28 Apr 2008

organising stuff

information aesthetics
Data visualization and visual communication ....

hey guys

check this out........

Thanks to walter .....

http://infosthetics.com/archives

19 Apr 2008

Network Culture 2

According to the K. Varnelis chart about network culture we have been working on diagrams in order to structure our brainstorming in categories.
We have chosen five big categories: culture, economy, nature, technology and politics.
In these categories we are trying to compare the developement between postmodernism and network culture along subcategories.

How does this sound to you? What have you been working on?

16 Apr 2008

COMPUTER


1987 - The first laptop successful on a large scale by U.S. Air Force
1989 - Macintosh Portable
1995 - Windows 95

INTERNET,WWW,Virtual networks

1991 - The precursor to Wi-Fi was invented by NCR Corporation / AT&T
2005 FEB- youtube
1993 - First Web magazine , The virtual journal,is published but fails commercially
1993 – Commercial providers were allowed to sell internet connections to indivisuals

POLITICS,SOCIETY,SECURITY

2002 - The total number of CCTV cameras in the UK is around 4,200,000

TECHNOLOGY

2005 - Closed Circuit Digital Photography (CCDP) can take 1600*1200 pixel resolution image
1995 - DVD
1988 - The first true camera that recorded images as a computerized file was likely the Fuji Ds – 1p
1987 - vision correction laser
1993 - Global Positioning System
1997 - Non-mechanical, Digital Audio Player

TERRORISM

2005 - London bombing

COMMERCIAL

2004 – In New York city , a yahoo! Autos promotion displayed on an LED billboard allowed one to call phone number with a cellphone and play a two-person racing game on the billboard
1990s early – The mobile billboard industry

HEALTH / MEDICINE

1997 - Viagra : Pfizer Inc
2006 – The world first ever cancer vaccine

Close-ups


Graphical Influences

Here are some links that may or may not help you develop a contemporary understanding of visual mappings...
(Some programs can allow you to add your own info... some you can understand the hierarchies and begin to format it on your own in illustrator (or something))

http://www.visualthesaurus.com/

http://www.win.tue.nl/~dholten/extravis/index.htm


http://www.timwalter.de/portfolio/textour/


http://www.tianamo.com/


Personal Facebook Mapping


Gapminder


http://megamu.com/lastfm/

http://www.humanbraincloud.com/view.php


http://cba.fro.at/timeline/


Also look at time magazines... they have the best diagrams... anyway... here is some eye candy...

Sketch for Knowledge Network

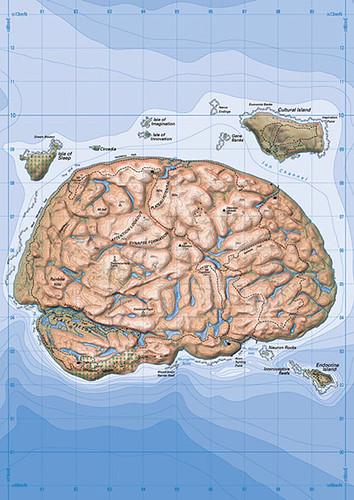
Here is a draft for an organizational model based on knowledge networks.
All nodes (and their edges) are color-coded according to the category of their topics.
Edge thickness indicates the level of connection between two topics.

This image is created using Silobreaker's Network Search and Adobe Photoshop, as
a sketch for the organizational model being developed by me. I am going to try to
script it using Processing to automate the process of creating the network so that we
could put more data into it in shorter time and to give it more functions (e.g. short
descriptions as tooltips) and add other parameters to the diagram (e.g. Time).


By the way, I found out about Silobreaker in VisualComplexity.com.