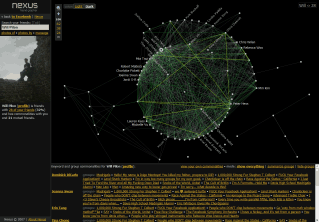
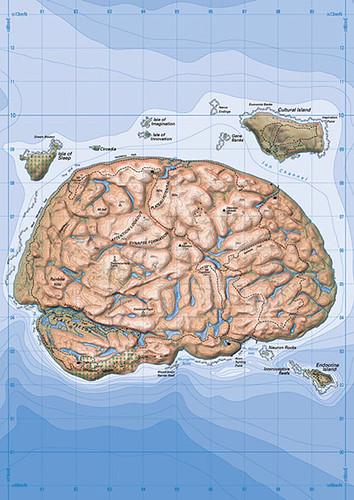
Here is a list of diagram types, which I found useful for depicting the changes of 1987-2008.
..brainstorming diagram
..cause & effect diagram
..charts & graphs (to illustrate changes of quantity)
..logical network diagram
..timeline diagram
..mindmapping.
Google to see the logic behind each type but as far as I know the first half of diagrams above are also available in Visio (software in Vista) or
click here to download SmartDraw.